Where is the best place to look for multi-baggers?

In last week's article, I looked at what investors could learn from the full list of multi-baggers from Ed's recent study. The evidence was clear: if investors had to pick one factor to look to find future multi-baggers, it would be the potential for rapid sales growth. Although operational leverage also aided strong returns, very few companies multi-bagged without seeing rapid sales growth. Here is the correlation I showed last week:
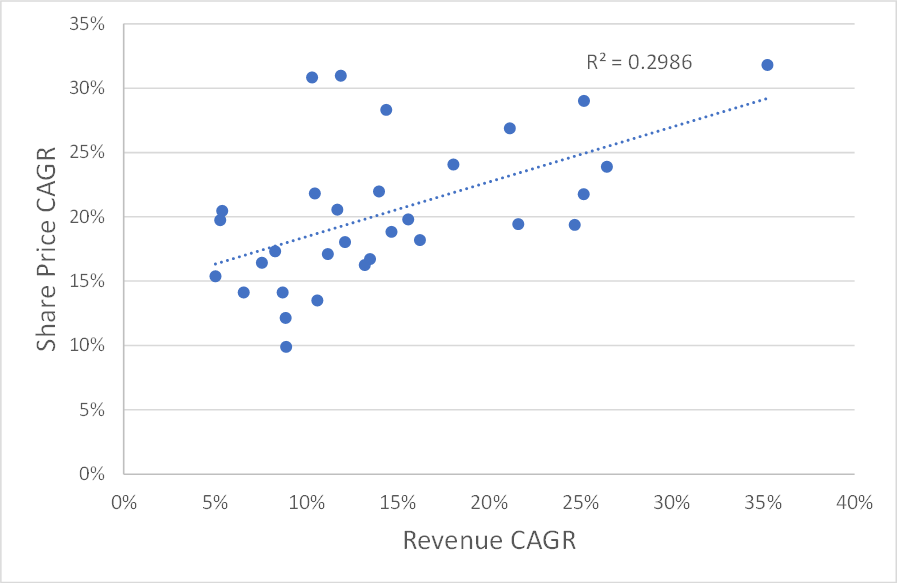
From this, it appears that investors seeking exceptional returns should simply screen for the fastest-growing companies in the market and invest in those. However, for this strategy to work, rapid historical growth rates would need to continue into the future. The big question is, how likely is this to happen?
Is revenue growth persistent?
The persistence of growth was analysed in a 2001 paper by Chan et al. called The Level and Persistence of Growth Rates. The authors concluded:
While some firms have grown at high rates historically, they are relatively rare instances. There is no persistence in long-term earnings growth beyond chance.
It doesn't look good, but the data used in the study ended in 1997, which was a long time ago. Many aspects of financial markets have seen significant shifts over the last two decades. Perhaps the rise of global tech and biotech firms means that rapid growth is more likely to continue in today’s markets?
Thankfully, Hedge fund Verdad Capital has updated these findings using data from 1997-2021. Their methodology involved looking at which proportion of stocks with growth rates above the median remained above the median over subsequent periods. They compared the results to what you'd expect from pure chance, for example by flipping a coin, to see if growth would be higher or lower than the median. Here are the results for US stocks:
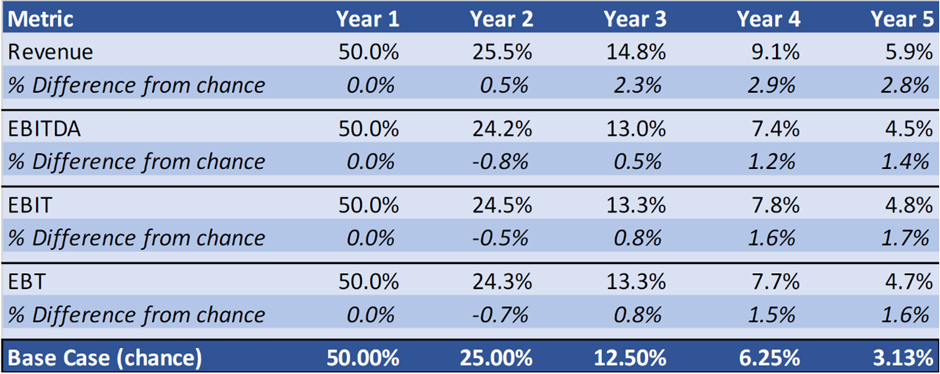
So, it seems that after one year, growth rates are effectively determined by chance. Over the long term, there appears to be some persistence of growth. For example, 5.9% of companies with sales growth rates above the median had sales growth rates above the median five years later. If this were purely determined by randomness, it would be expected that just 3.1% of them would. However, given that there appears to be no persistence above chance over one year, I don't think we can rule out other factors here.
The absolute numbers are small, too. Ed found 37 stocks that had been multi-baggers over the last decade. This means just two of these will likely have sales growth rates above the median for the next five years. Not only that, but the persistence of earnings growth is even weaker than the persistence of revenue growth. Some companies seem to retain their above-median sales growth rates but at the cost of declining operating and net margins. The exact opposite of the kind of companies we are looking for.
These figures only look at companies with above-median growth rates. We are after the fastest-growing companies, so perhaps the companies with the fastest recent growth will show greater persistence. Verdad also tested this by running the same analysis, looking at which proportion of the 25% fastest-growing companies had above median growth rates in the future:
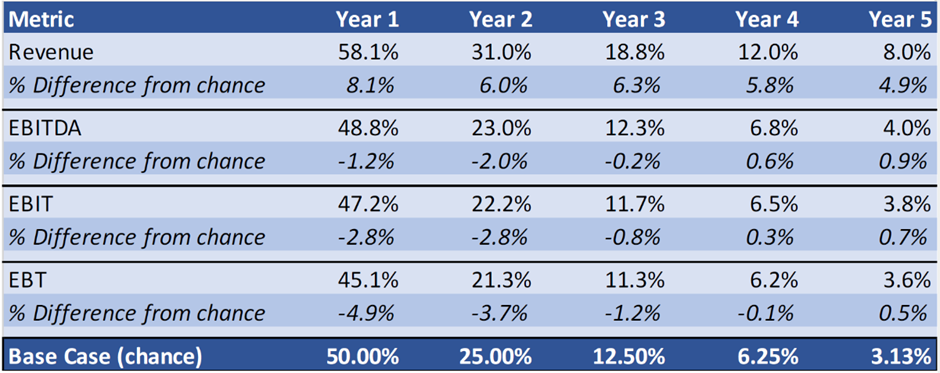
Here, we see some persistence in revenue growth (although this is only those that stay above the median, not in the top quartile), but the story is much worse as we go down the income statement. By buying a company with top-quartile growth in earnings, an investor is no more likely to have above-average earnings growth five years later than if they'd simply picked a stock at random.
This is based on US data, but Verdad also looked at the persistence of EBITDA growth in Europe and Japan. Using a slightly different methodology of looking at the fastest growing TTM EBITDA quintile to the slowest growing quintile, this is what they found:
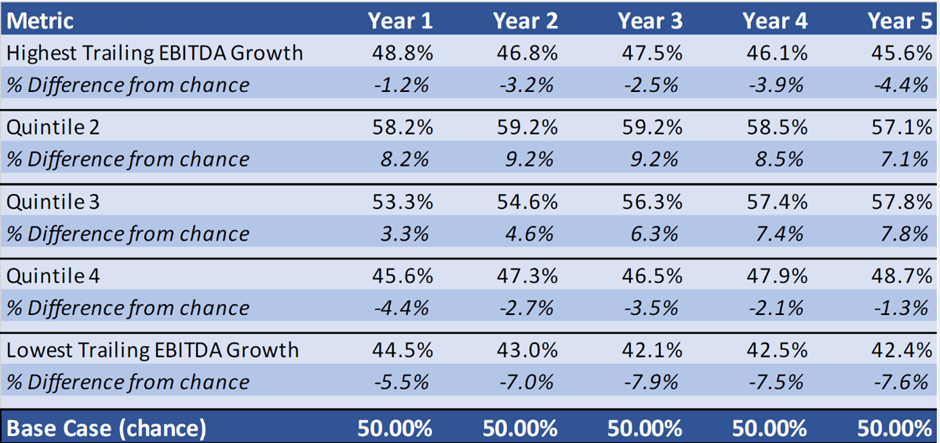
Here is the data graphically (greater than zero implies incidence higher than should happen purely by chance, less than zero, lower incidence):
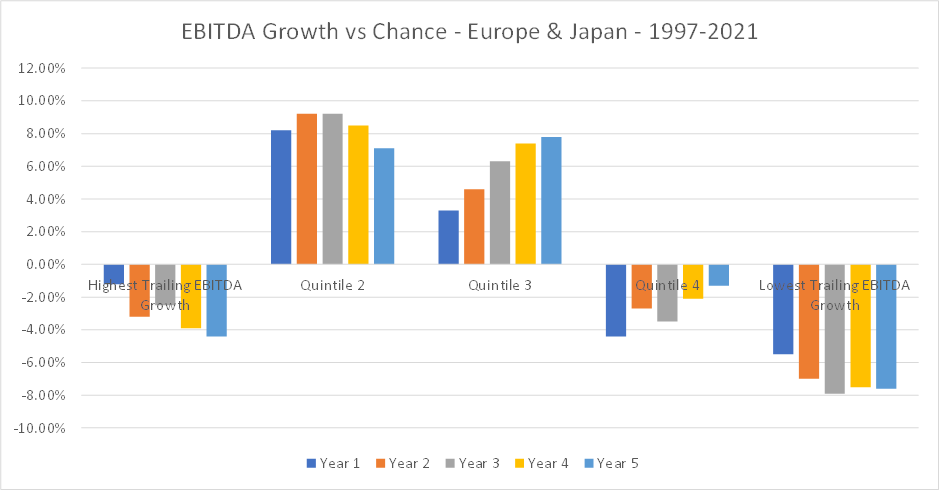
It seems that all things being equal, investors would be better off investing in the middle of the pack when it comes to growth rates. It must be noted that this would only generate higher stock returns if there is no difference in the price paid for stocks that have grown rapidly in the past versus those that have had more mediocre growth. And the numbers here are still small and may well be statistically insignificant.
This has significant implications for our search for multi-baggers. It means that the stocks with the highest historical revenue growth rates from Ed's historical multi-baggers are not the place to look for future multi-baggers. Especially if they are now on high multiples, such as these:

This may seem paradoxical since these are some UK stocks where revenue has grown the fastest. However, this is what the data tells us. These stocks are unlikely to be fast growers in the future simply because they are fast growers in the past. Indeed, they are slightly less likely to be fast-growers than a randomly chosen stock. For the majority of these that fail to demonstrate rapid future growth, multiple contraction will further hurt investor returns.
Can brokers' forecasts help identify fast-growing stocks?
It may seem that the best way to find fast-growing stocks is to look at the analysts' consensus for earnings growth. While analysts' forecasts aren't equivalent to random guesses, there are some issues in relying on them to find rapidly growing companies. Ed discussed how investors can't rely on broker recommendations here.
When it comes to estimates of earnings, a 2016 Paper by Andrew Stolz showed that analysts' forward earnings estimates one year ahead are too optimistic by 25.3%, on average. The median net income 10-yr CAGR of the multi-baggers in Ed's study was just 18%. So, a 25% overestimate means that investors cannot trust analysts to spot high-growth stocks for them. (Or, more precisely, investors cannot trust analysts not to call every stock a high-growth stock since the overestimation tended to be concentrated in the weaker performers). In the short term, let alone over more extended periods, making investment decisions purely on these estimates is a fool's errand. It can be hard to believe that analysts can make those magnitude of errors repeatedly and still keep their jobs. However, as Stolz points out:
In general, financial analysts are optimistically biased, or what the average person would call being "wrong," in their earnings forecasts, yet they continue to maintain their jobs and draw significant salaries. This implies that they perform other valuable functions, such as helping their clients increase their knowledge of the companies or industries that the analysts cover or the country that those stocks are listed in. Another such function is that of fulfilling the desire to know the unknowable (the future), and therefore believe that the unknowable is in fact knowable.
It seems that helping investors find stocks with the potential to multi-bag is pretty low down on analysts' lists of things to focus on.
As a result of this, it becomes obvious why the Stockopedia StockRank doesn't include the Growth Rank. It is because there is little academic evidence that focusing on growth metrics can generate outperformance, at least on a quantitative basis.
Where does this leave us?
This may seem a rather depressing reality check. However, it needn't be. The thing to remember about Ed's multi-bagger study is that it aimed to identify the highest-performing stocks of the last decade and then go back in time and look at the qualities that made them exceptional at the start of their ten-year multi-bagger journey. The precise stocks don't matter since these are unlikely to be the big winners of the next ten years. It is the principles that we want to take on board. The best place to look for multi-baggers is in the set of stocks that look like the list of muti-baggers before they started their incredible journey of outperformance, not what they look like now.
As for rapid sales growth, if investors focus on the Moat and Runway parts of my MROC multi-bagger framework, they are likely to have more success than if they focus on recent sales growth or broker forecasts. Runway is almost impossible to screen for and requires a more qualitative analysis. However, screening for a high 5yr Average ROCE may go a long way to finding future high-performing stocks:
![]()
When you add in some factors that allow for operational leverage, such as low net margin, this further increases an investor's odds:
![]()
By making sure that the chosen stocks are cheap, investors complete the MROC framework:
![]()
Finally, investors may want to limit their search by excluding extractive industries and limiting their search to the most likely market cap range:
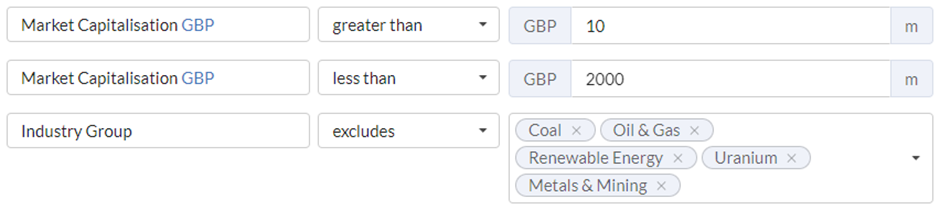
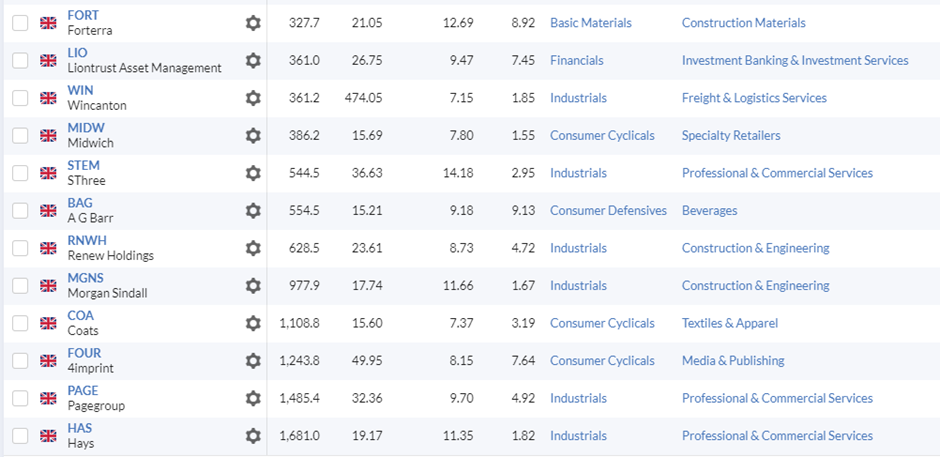
Screen Results
This screen currently generates 30 results:
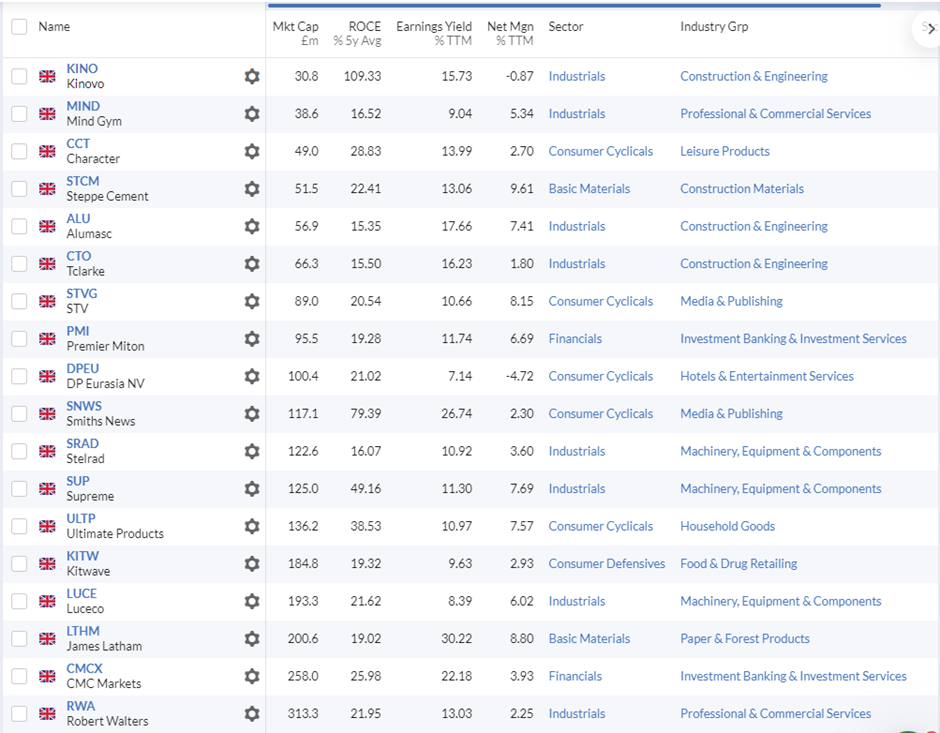
Like any screen, it will only be the starting point for an investor's research. For example, Smiths News (LON:SNWS) is unlikely to have a significant runway ahead of it due to being in a declining industry. However, this screen will likely be a better starting point than the list of past multi-baggers.
[Disclosure: Mark owns shares in Luceco (LON:LUCE) ]

About Mark Simpson
Value Investor
Author of Excellent Investing: How to Build a Winning Portfolio. A practical guide for investors who are looking to elevate their investment performance to the next level. Learn how to play to your strengths, overcome your weaknesses and build an optimal portfolio.
Disclaimer - This is not financial advice. Our content is intended to be used and must be used for information and education purposes only. Please read our disclaimer and terms and conditions to understand our obligations.

A very interesting article - many thanks Mark. If identifying companies with the potential to grow sales significantly over 5-10 years is the key to multi-bagger returns and high historic growth levels is not particularly helpful, it raises the key question of - how do you identify those companies with the potential for prolonged future sales growth? I suspect the answer to this question is through some form of qualitative analysis rather than screening but I haven't yet found a good framework for evaluating this. Hence, I'd be interested in your thoughts, perhaps in a future article, as to how you evaluate if a company has a good 'runway' ahead of it.
Useful article ….I have had just a few multibaggers (Maoist of which came back down to earth with a a bang) but they were picked up from ideas and comments from subscribers rather than digging through endless lists.
Would it be possible to have a ‘ Subscriber’s Potential Rocket Launch List’…….where great ideas are put out there (NOT TO RAMP) so that we can all do our own checks and research and maybe have a dabble if inspired……That’s how I got into EEE at 2.5p not that long ago….Without a comment from someone I wouldn’t have even heard of the company
Another good article Mark. re the hedge fund you link to - I see they have a number of interesting articles - these jump out at me
https://verdadcap.com/archive/... A Rule of Thumb for Terminal Valuation Multiples - this is along the lines of cruel realities of investing is that growth does not persist - very relevant to the points you & Ed raise
plus
https://verdadcap.com/archive/... - The Death of Small Cap Equities? - snippet - Trend: US declining quality with EU/Japan increasing but IT being an exception driven by mega cap tech's.
Watching the multi-baggers study, reminded me of "The Perfect Stock" article that Ed wrote earlier in the year. The conclusion to that article was that whilst it may be next to impossible to identify the perfect stock, a portfolio of slightly imperfect stocks would, in combination, meet the "perfect" criteria. Wondering where I might find such a potential ten-bagger portfolio, I decided to check the US Nasdaq index, in the form of the ETF QQQ.
Over the period of Ed's multi-baggers study (20.4.13 to 19.4.23), and corrected for currency changes, QQQ delivered a 5.73x return (in £UK). Not bad, if not quite a ten bagger.
So then I thought, how far back one would one have to go from now (it was actually on the 22.11.23 when I checked this), to achieve a QQQ ten bagger? It turns out to be a little over 12 years (22.8.11 to 22.11.23).
Will the Nasdaq/QQQ go on to achieve another ten-bagger in the future? Who knows, but on the basis that it comprises a portfolio of only slightly imperfect stocks, for my money I reckon it makes a good bet.
Thanks Mark, really interesting article. I'd be more convinced by the argument if instead of measuring the proportion of stocks exceeding median growth rates over a run of years, the data looked at persistence on a CAGR basis since this is what counts. Falling below median in a given year doesn't really matter barring a blow up and strikes me as highly likely given the economic cycle.
Conversely, is it true that Ed's list of multibaggers all recorded high percentile growth rates in each of the preceding 3/5 years (or whatever period the study looked at to define historical growth stocks)?
Hi Matthew,
That’s certainly a fair critique of the Chan/Verdad research. I think that the multi baggers tended to have strong revenue growth prior to the study period is an interesting counterpoint, but one that isn’t conclusive evidence. After all, there could well be many others with fast revenue growth 2010-2013 that proved to be slow growers 2013-2023.
The other factor could be that almost all companies that survived the GFC would show rapid revenue growth as they recovered from it. So to answer the question we really need to test the future revenue and PAT growth rates of say the top 10% of revenue growth at the start of each year over the next 5 years. Certainly a good research project if I can get the data.
Mark
Hi Mark,
Yes, not only would almost all companies show rapid growth in the GFC recovery but I would guess that the most cyclical companies would show the greatest growth, potentially pushing compounders (which have superior longterm growth rates) below the median for one or two years. Similarly, such cyclical stocks would then populate the baseline set of fast growers over which subsequent performance is measured further distorting the results. I'm not sure if this is the same as what you are saying so apologies if so.
Also, regarding Ed's multi baggers I did not mean to say that they were strong growers prior to 2013 and therefore supported the argument for persistence and agree that cherry picking would be an issue with such a line of reasoning.
I meant that even though they demonstrated high CAGR from 2013 to 2023, is it possible that they would have failed to achieve above median growth in each and every one of the 3 or 5 years prior to 2023? I believe that in the original study, the set of fast growing stocks was defined as exceeding median growth in each year of a 3 or 5 year period rather than in just the preceding year although I could have that wrong. In other words, is it even the case that Ed's multi baggers fall within the group over which subsequent performance was measured in the original study?
Finally, in my view it would not be sufficient to look at the top 10% performers over a one year look back period to find out if growth persists because a year is too short. My intuition says that at least a five year look back would be better since it should somewhat smooth out cyclical effects described above. For example, Shiller's CAPE ratio looks back 10 years for this reason.
I am no statistician so apologies if this is somewhat confused. I know what I'm trying to say but not quite sure how to communicate it precisely.
Matt
Yes. Not sure it's a long-term multi-bagger, but it looks too cheap. I'm a big believer in mean-reversion, so I expect fund flows and performance fees to recover rapidly when UK small caps do.
Hi Alex,
I own Liontrust Asset Management (LON:LIO) . If you look at the charts it is starting to form a base. There hasn't been much share dilution over the past few years, so as Mark has correctly pointed out once funds start to flow back into LIO then I too believe the shares will climb back up to their previous 2400p - 2500p level. This would make it a 4 bagger. In the time being I'm just collecting the double digit dividend whilst I wait for recovery which I reckon will start in earnest in 2024 once interest rates start to fall in a few months time.


*Past performance is no indicator of future performance. Performance returns are based on hypothetical scenarios and do not represent an actual investment.
This site cannot substitute for professional investment advice or independent factual verification. To use Stockopedia, you must accept our Terms of Use, Privacy and Disclaimer & FSG. All services are provided by Stockopedia Ltd, United Kingdom (company number 06367267). For Australian users: Stockopedia Ltd, ABN 39 757 874 670 is a Corporate Authorised Representative of Daylight Financial Group Pty Ltd ABN 77 633 984 773, AFSL 521404.
This sounds like a very thoughtful and perceptive article. I had been thinking that there was little point in buying into those companies which had already done it.