How to find breakout stocks with positive price momentum

For a good chunk of 2018, the UK’s equity markets were under the cosh and index prices fell across the board. But since the start of this year, there’s been a sense of optimism around. Political and economic uncertainties aside, the FTSE All-Share has managed a 6.8 percent gain in recent weeks. It’s a modest result, but one I reckon most investors are happy to take.
That said, 6.8 percent is just the index, or average, gain. Lift the lid and you’ll find that some stocks have done far, far better than that (and others, of course, far worse). What’s interesting, according to research, is that stocks with the strongest outperformance have a statistically strong chance of maintaining that trend. This is the power of one of the most powerful ‘factors’, or return-drivers in the stock market: momentum.
Digging into momentum
In investing, momentum is the tendency for price trends to persist. It causes securities with rising prices to rise further, and securities with falling prices to fall further. It sits alongside other factors like ‘value’ and ‘quality’ as a cornerstone of some of the most influential strategies around. (Regular readers will know that these factors are a core part of our philosophy here at Stockopedia - and we talk about them a lot).
Over the past 30 years some of the smartest minds in finance have studied why momentum works and how it can be captured.
Some believe that just like value investing, there’s a risk premium attached to momentum. In other words, its profits only exist because there are times when the strategy doesn’t work. It’s known that momentum can crash periodically. In years like 2018, when a lot of fast-growing momentum stocks were pegged back, momentum strategies really suffer. As Wes Gray, the boss of US quant fund firm Alpha Architect said to me last year, “when you look at real momentum strategies done the way that gives you those historical premiums, those portfolios are hair-raising.”
Another much more accepted view of momentum is that it’s caused by investor behaviour and their underreaction and delayed overreaction to news. With underreaction, prices are slow to react because investors are either cautious, not looking or can’t trade. But with delayed overreaction, investors chasing rising prices attract the attention of the investing herd, who follow them into those trades, pushing prices higher and higher.
Chasing price momentum
One of the original “pure” momentum strategies was one developed by the researchers Narasimhan Jegadeesh and Sheridan Titman. Their work looked solely at a stock’s price strength relative to the rest of the market. They found that momentum often lagged for the first month but then accelerated over the subsequent six to 12 months.
They wrote: “The strategy we examine in most detail, which selects stocks based on their past 6-month returns and holds them for 6 months, realises a compounded excess return of 12.01% per year on average.”
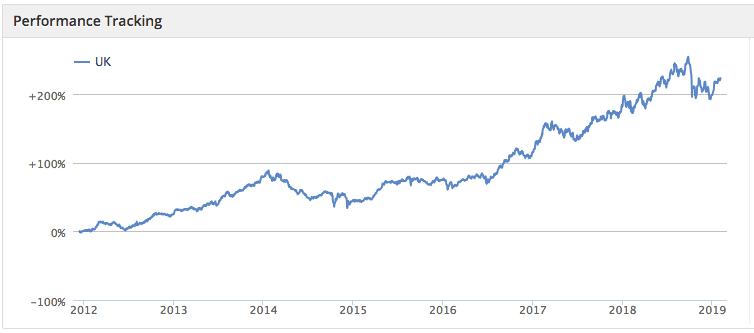
This is a strategy that we track here at Stockopedia, and it has proved to be pretty resilient over the past six years. But in the chart below you can also see how the kinds of conditions we saw in 2018 cause momentum to pull back very sharply. You can find the screen here.
Even so, over the past two years this strategy of just buying the strongest momentum stocks has resulted in a pre-costs return of 37 percent (when the portfolio was refreshed quarterly), and 12 percent over the past year.
So what are the stocks currently passing these momentum tests? Of the top 30 companies across the market, here are the top 5 sorted by the strongest relative price strength over the past year:
Name | Mkt Cap £m | Relative Strength 1y | Relative Strength 6m | Relative Strength 1m | Sector |
411.3 | +341.7 | +50.1 | -10.5 | ||
100.1 | +140.8 | +132.6 | -1.51 | ||
160.3 | +120.6 | +50.7 | -18.0 | ||
22.9 | +116.1 | +52.6 | -7.38 | ||
81.9 | +116 | +16.9 | -2.08 |
As you can see, the stocks tend to be small and more speculative, but they’ve all see very strong relative price strength over the year.
But if you re-sort that top 30 list and focus on the largest price momentum stocks, the top 5 look like this:
Name | Mkt Cap £m | Relative Strength 1y | Relative Strength 6m | Relative Strength 1m | Sector |
7,261 | +40.4 | +11.3 | -6.60 | ||
3,948 | +81.5 | +9.30 | -5.00 | ||
2,160 | +38.6 | +23.4 | -0.55 | ||
1,702 | +53.4 | +21.9 | -0.55 | ||
950.6 | +34.7 | +3.40 | -8.66 |
Here we’ve got companies like Pearson, Hikma and Quinetiq, which have very much been stocks in recovery over the past year. They mix it up with companies like 3i Infrastructure, which resisted the market slide altogether, and Games Workshop, which surged early in 2018 and didn’t fall as hard when the market slumped later on.
Last year, this Price Momentum strategy picked up some big winners including stocks like Ocado, Games Workshop, Plus 500, Blue Prism and Oxford Biomedica. But at times it also held stocks that went on to seriously underperform, like IQE, Yu and Cloudcall.
So while momentum strategies are designed to select the strongest performing stocks in the market, they’re not infallible. Pure price momentum, combined with no other factors, can highlight popular story stocks that can be very speculative. They may well do well, but serious care is needed. But the strategy can also highlight larger stocks bouncing back from difficult times or those more resilient to depressed conditions. For some at least, the evidence suggests that stocks with this kind of profile will often continue to outperform.
So while it can be scarily volatile, momentum is well recognised as a powerful driver of market returns. It can be a handy pointer to the market’s strongest performing stocks and it has a performance track record that’s hard to ignore.

About Ben Hobson
Stockopedia writer, editor, researcher and interviewer!
Disclaimer - This is not financial advice. Our content is intended to be used and must be used for information and education purposes only. Please read our disclaimer and terms and conditions to understand our obligations.

The fees don't concern me unduly (part of these are performance related) provided 3IN perform well. I guess that it is the fees putting a lot of people off and slowing the upward price adjustment. It was the only share in my portfolio not to take a hit in Q4 2018 correction and I value this aspect as part of a mixed investment portfolio.

Always good to have shares that don't fall in a correction. But there were a few others I know of: Sopheon (LON:SPE), Greggs (LON:GRG), Telecom Plus (LON:TEP) and a few others that were flat such as Shoe Zone (LON:SHOE) which did then break out. The problem I have with this screen is any share that breaks out will be soon demoted, it only has to go above the price 1m prior to be deselected. You are also holding onto shares that are falling in price. It is also very short term, very few are over 1 month old, so trading costs will be high, imagine trading 20 out of 25 shares each month, that will cost around 2-3% per month?

I’m also at a loss to understand why the screen includes negative RS for the previous month. I’ve had a skim of the original paper, which is heavy going so I may well have missed it, but I don’t see any basis in it for that criterion. Maybe it comes from later work by them. It seems daft to me and I suspect it’s an error.
http://www.business.unr.edu/faculty/liuc/files/BADM742/Jegadeesh_Titman_1993.pdf
I’m another recent £3IN buyer - it was the premium to NAV that was putting me off before I gave in and bought a small amount.

[a bit bizarre most of my post disaapeared! - Now readded]
No offence intended but I can't help but wonder if you are "over-obsessing" on the point about RS 1m < 0.
Assuming that it is is not a rule that was added on a whim or in error. Then isn't it likely that whilst some 'good' candidates will be exclude by the rule and greater number of 'poor' candidates will also be excluded?
FWIW I have created two branches of the screen - one with RS 1m <0 and the other excluding this rule. To avoid there being too many selections I have had to also (arbitrarily) added mkt cap £m <300.
Obviously it would take a substantial amount of time to demonstrate any meaningful difference between the two, but nevertheless I'll report back in a couple of months as to whether there is anything indicative we can see.
Just to note based on the figures today the 'as is' screen produces 89 selections and with the RS 1m rule excluded there are 184 selections (so 95 with RS 1m >= 0)
Watch this space!
Assuming that it is is not a rule that was added >= 0).
??
I don't think that there is any basis for a 1 month RS rule based on the original work.

https://help.stockopedia.com/p...
The momentum research suggests that relative strength is a negative signal in the very near-term (less than 1 month) and the very long-term (3 yrs +) but generally a positive indicator in the medium-term (3-12 months) - we focus on medium to long term factors in this momentum rank. ....
I think < 0 is a very important rule in that screen, for a momentum screen it does not make sense to me. The other issue is most shares don't last much more than 1 month > 0 will have more selections and no doubt some longer holdings, including many breakouts, unfortunately I can't see that when you create your own version.

I looked at this the last time it came up and I could not find any evidence that negative short term momentum is a good thing, even when combined with positive medium term momentum.
Here is my plot of the "likelihood ratio" for the crosstab of 1-month price change versus 6m RS (I do not have a one-month RS available to me).
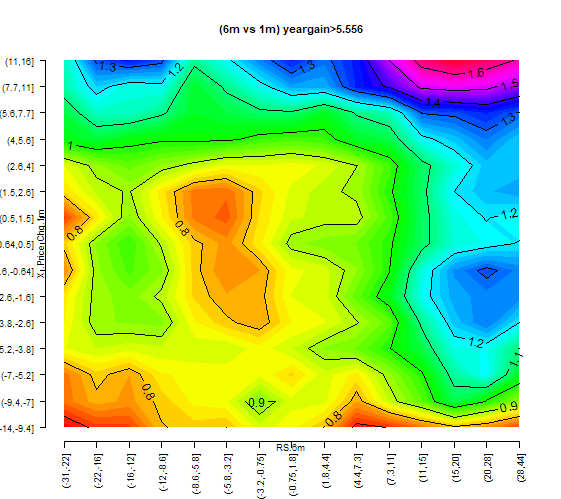
Basically any value >1 in the contour plot above indicates better than median performance for the next year (and the number itself is the decimal odds.)
So a quick summary from this data seems to be that high "RS 6m" is good and the "1m" data is not as important but positive "1m" momentum is better than negative. The highest part of the plot is in the top right hand corner where both 1m and 6m momentum are high.
But as they say, "your mileage may vary". Maybe if I had "RS 1m" data there would be a dramatic change in the plot.
The RS 1 month reversal is from academic studies:
"When testing momentum in stock returns, we need to first identify the time period over which we will calculate the momentum variable. Below we summarize the main academic research findings for three different look-back momentum calculation periods:
Short-Term Momentum (1-month) – exhibits a reversal in returns(7)
Long-Term Momentum (3 to 5 years) – exhibits a reversal in returns(8)
Intermediate-Term Momentum (6-12 months) – exhibits a continuation in returns(9)
In short, both short-term and long-term momentum signal a future reversal in returns. In other words, one can expect these stocks to underperform. However, intermediate-term momentum provides a continuation of returns−the so-called “hot-hand”−and these stocks tend to outperform.
https://alphaarchitect.com/2015/12/01/quantitative-momentum-investing-philosophy/
i.e. positive 1m momentum has been found to be a bad thing. Whether that extends to negative 1m combined with positive 6-12m is a good thing is a totally different matter however.
I can't access that site right now (blocked by the WiFi provider I'm currently using!) but I was reporting what I have found myself. I will have a look at that site whe I get back on a decent web service!
However what does occur to me is that if there were a negative response to 1m RS and positive for 6m RS the implication is that there is a "harmonic" (i.e. oscillating) component, whereas a positive response to any momentum period would indicate simple geometric behaviour (difference between a first order recurrence relation and second order.) And personally I would want to then know where the periodicity is coming from?
i.e. positive 1m momentum has been found to be a bad thing. Whether that extends to negative 1m combined with positive 6-12m is a good thing is a totally different matter however.
Thank you for that. I now understand that:
Alone negative 1m RS is bad on balance.
With 3m, 6m, 12m etc.. we don't know, although trend followers who buy on breakouts and new highs (like I've been known to do) may have been scratching their heads at the assertion that 1m RS is a 'bad factor' as it didn't seem to make logical sense (especially when combined with other price momentum factors).
I have a few articles on Narasimhan Jegadeesh and Sheridan Titman, I can't see anything about selling if RS1m is positive. They usually hold for 3-12 months after selection. I'm not a Minervini expert but I don't think he buys when the momentum is negative. The problem is if you sell as soon as RS1m goes positive then you may miss out on breakouts which is what this article is about. Take some where I have changed the RS1m to positive: Augean (LON:AUG), Britvic (LON:BVIC), NMCN (LON:NMCN), RM (LON:RM.), Shoe Zone (LON:SHOE), Yourgene Health (LON:YGEN), Eco Atlantic Oil & Gas (LON:ECO), T Clarke (LON:CTO) are some of the better ones, sure some will go positive and then fall back again but looking at the charts I can't see many negative ones. Maybe it's just the market, do you want to hold shares that are falling when the market is rising?
This screen has performed poorly with European shares (inc. UK) it is -2.5% over 5 years.
"When testing momentum in stock returns, we need to first identify the time period over which we will calculate the momentum variable. Below we summarize the main academic research findings for three different look-back momentum calculation periods:In short, both short-term and long-term momentum signal a future reversal in returns. In other words, one can expect these stocks to underperform.
- Short-Term Momentum (1-month) – exhibits a reversal in returns(7)
- Long-Term Momentum (3 to 5 years) – exhibits a reversal in returns(8)
- Intermediate-Term Momentum (6-12 months) – exhibits a continuation in returns(9)
However, intermediate-term momentum provides a continuation of returns−the so-called “hot-hand”−and these stocks tend to outperform.
https://alphaarchitect.com/2015/12/01/quantitative-momentum-investing-philosophy/
i.e. positive 1m momentum has been found to be a bad thing. Whether that extends to negative 1m combined with positive 6-12m is a good thing is a totally different matter however.
I had a quick look at the website linked above and also the paper they reference to confirm the statement:
- Short-Term Momentum (1-month) – exhibits a reversal in returns
The method they describe is a straightforward high-Sharpe-Ratio method (which I also use) and they compute 12-month momentum by counting back skipping the current month but they don't actively avoid a stock if it if it has negative momentum in the current month.
The linked paper (which is very heavy going btw!) seems to say that the negative momentum effect if it exists at all is very short lived -- i.e. if a stock has negative momentum this month it might affect the following month but will not be significant beyond that (and if I read it correctly they were stating that negative momentum this week affects next week, rather than going from month to month.)
For anyone pursuing a momentum strategy, I would recommend a quick read of this paper;
Taming Momentum Crashes: A Simple Stop-Loss Strategy
https://papers.ssrn.com/sol3/papers.cfm?abstract_id=2407199
The authors test the effect of various stop levels on a momentum strategy, with back-test data going back over 80 years.
TLDR; Returns are greatly enhanced and risk diminished...
At the risk of derailing this discussion further it seems we should stop following momentum as defined by relative strength and instead focus on the trend in the individual share. This is the conclusion of a major study going back over 200 years of data by Pim Van Vliet and colleagues at Robeco. They conclude that factor based investing does work, and that the best factor is trend following.
I expect there will be quite a few articles to be written about this. I read about it first in John Authers piece on Bloomberg.
https://www.bloomberg.com/opinion/articles/2019-02-07/eternal-market-patience-offers-eternal-rewards
This blog summarises. https://investresolve.com/blog/over-two-centuries-of-global-factor-premiums-paper-summary/
Original paper here. https://papers.ssrn.com/sol3/papers.cfm?abstract_id=3325720
Buying at a premium is never great value but the annual fees quoted would include performance fees which are not paid unless the manager exceeeds certain amounts which I understand to be 8%. The fee is 20% on the excess and you could consider this is good as the investor is also doing well. There is also a high watermark which means generally means it only continues to be paid as the price exceeds previous highs.


*Past performance is no indicator of future performance. Performance returns are based on hypothetical scenarios and do not represent an actual investment.
This site cannot substitute for professional investment advice or independent factual verification. To use Stockopedia, you must accept our Terms of Use, Privacy and Disclaimer & FSG. All services are provided by Stockopedia Ltd, United Kingdom (company number 06367267). For Australian users: Stockopedia Ltd, ABN 39 757 874 670 is a Corporate Authorised Representative of Daylight Financial Group Pty Ltd ABN 77 633 984 773, AFSL 521404.
I guess the main risk is that £3IN is trading at a 24% premium to NAV, probably because private capital is currently pouring into infrastructure and maybe less opportunities present to invest the cash. The other issue seems to be the high ongoing charges for this trust. The Investors Chronicle lists it at 6.91% (data from 21st January). I guess these don't matter as much while the momentum carries on, but they would matter much more if things suddenly changed.